decorative
Retirement Insights
8 min

Retirement Pulse // July 2026

Research, regulations, returns and trends

MFS Retirement Takes

Excerpt from mid-year Retirement Trend Report

70%↑

OF PLAN SPONSORS SAY PERSONALIZED ADVICE IS THE #1 OUTCOME DRIVER
 

61% 

OF PLAN SPONSORS ARE NOT EVALUATING PRIVATE ASSETS


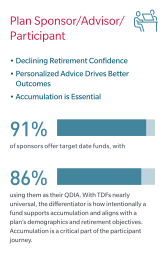
86% 

USE TDFs AS THEIR QDIA


To learn how MFS can support better retirement outcomes, visit mfs.com/retirement.


The retirement conversation is evolving, and it’s happening on three distinct fronts. Learn more in our Retirement Trend Report.

Sources:
2026 MFS DC Plan Sponsor Survey, 2026 MFS Retirement Plan Advisor Survey, 2025 MFS Global Retirement Survey. For survey methodology, please visit https://www.mfs.com/content/dam/mfs-enterprise/email_assets/link-assets/mfsi/SurveysMethodology.pdf


Retirement Regulatory and Legislative Happenings  

Reduced Social Security Benefits?

The trustees of the Social Security trust fund released the annual Trustees Report in June 2026. The retirement trust fund is projected to be depleted  in the fourth quarter of 2032, one quarter earlier than projected in last year’s report. 

This is the new estimated date that the retirement trust fund will become insolvent if Congress does not act. 

At that point, the retirement trust fund will only be able to pay out as much as it brings in through tax revenue. Actuaries estimate this to be 78% of total scheduled benefits.

alt=scale icon

DOL Enforcement Priorities

In April 2026, the DOL set forth its Employee Benefits Security Administration (EBSA) enforcement priorities and guiding principles:

1. Focusing enforcement on the most egregious conduct and significant harm;

2. Ensuring that EBSA does not regulate by enforcement and instead promotes fairness, prior notice, and clarity to the regulated community;

3. Requiring a proper review by senior agency officials of all critical enforcement initiatives; and

4. Committing to timely and responsive enforcement.

scale icon

DOL Developments 

In April 2026, Labor Secretary  

Lori Chavez-DeRemer resigned following an internal investigation. Deputy Secretary Keith Sonderling became acting secretary. 

As reported in our last update, the DOL issued the Investment Selection Rule, with a comment period that ended June

1. The DOL received over 47,000 public comments, highlighting the retirement industry’s interest in the proposed rule. The final rule may be issued by the end of the year. 

Expanding Retirement Access

In April 2026, President Trump signed an executive order directing the Treasury to set up a federal IRA savings program for workers who do not have a workplace retirement plan. 

The order directs the Treasury to establish TrumpIRA.gov and for it to be operational by January 1, 2027; this includes ensuring that those who contribute and are eligible receive the Federal Saver’s Match contribution (up to $1,000 per year to eligible lower- and middle-income workers). 


Retirement Market Data

A closer look at target date fund investors over time
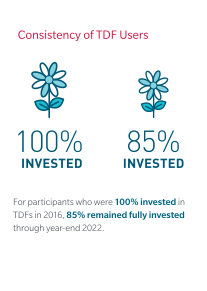
graphic showing average number of funds held is 3.6 across all participants and 5.2 excluding tdf users
graphic showing 95% offer target date funds, 48% of plan assets in target date funds and 57% of contributions go to target date funds
4.8 trillion usd total target date funds assets by end of 2025 with 20.3% growth over previous year


Takeaway: 

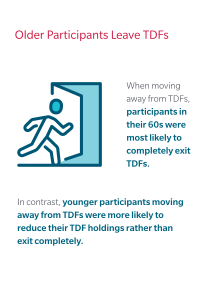
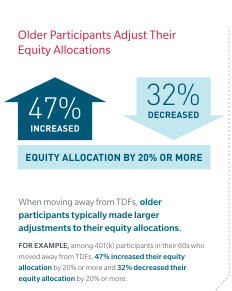
We know TDFs are popular. This study focuses on the decisions TDF-invested participants make, and it highlights that retirement is personal. Older participants tend to exit TDFs and could benefit from advice.

Source: 
Sarah Holden, Emily Williams, Steven Bass, and Craig Copeland, “A Closer Look at 401(k) Plan Target Date Fund Investors’ Account Balance Asset Allocations Over Time,” EBRI Issue Brief, no. 658, and ICI Research Perspective, vol. 32, no. 6 (May 2026). 


Investment Index Returns 

As of June 30, 2026 

BENCHMARK

10 YEARS

5 YEARS

3 YEARS

1 YEAR

YTD

3 MONTHS

BALANCE

Illustrative 60/40 Portfolio

9.98%

8.10%

13.92%

14.76%

6.45%

9.31%

EQUITY

S&P 500

15.51%

13.41%

20.61%

22.32%

10.21%

15.20%

Russell 1000® Growth

18.58%

13.71%

22.58%

17.71%

5.33%

16.74%

Russell 1000® Value

11.52%

11.17%

17.79%

27.12%

16.26%

13.87%

Russell 2000®

11.62%

6.98%

18.60%

40.78%

22.57%

21.49%

MSCI EAFE

9.66%

9.05%

16.44%

20.23%

9.44%

10.82%

MSCI Emerging Markets

10.07%

7.20%

23.03%

43.51%

23.85%

24.05%

MSCI ACWI

12.78%

10.98%

19.70%

23.67%

11.25%

14.93%

FIXED INCOME

Bloomberg US TIPS

2.58%

1.01%

3.98%

3.42%

1.15%

0.89%

Bloomberg US Aggregate

1.54%

0.08%

4.16%

3.79%

0.62%

0.67%

Bloomberg Global Aggregate

1.92%

0.88%

4.50%

3.17%

1.15%

1.30%

CASH

Cash

2.40%

3.69%

4.86%

4.05%

1.87%

0.93%


Sources:
SPAR, FactSet Research Systems Inc., MFS analysis. Illustrative 60/40 portfolio comprises 60% S&P 500 and 40% Bloomberg US Aggregate and is rebalanced monthly. This hypothetical example is for illustrative purposes only. MSCI indices shown are net returns. Returns for the Bloomberg Global Aggregate Index are hedged to USD.
Cash is based on returns for the FTSE 3-month Treasury Bill Index. 
The historical performance of each index cited is provided to illustrate market trends; it does not represent the performance of a particular MFS® investment product. It is not possible to invest directly in an index. Index performance does not take into account fees and expenses. Past performance is no guarantee of future results. You should consider your client’s financial needs, goals, and risk tolerance before making any investment recommendations.


Disclosures

“Standard & Poor’s®” and “S&P®” are registered trademarks of Standard & Poor’s Financial Services LLC (“S&P”) and Dow Jones is a registered trademark of Dow Jones Trademark Holdings LLC (“Dow Jones”) and have been licensed for use by S&P Dow Jones Indices LLC and sublicensed for certain purposes by Massachusetts Financial Services Company (“MFS”). The S&P 500® is a product of S&P Dow Jones Indices LLC, and has been licensed for use by MFS. MFS’ product(s) is not sponsored, endorsed, sold or promoted by S&P Dow Jones Indices LLC, Dow Jones, S&P, or their respective affiliates, and neither S&P Dow Jones Indices LLC, Dow Jones, S&P, their respective affiliates make any representation regarding the advisability of investing in such product(s).

Frank Russell Company ("Russell") is the source and owner of the Russell Index data contained or reflected in this material and all trademarks, service marks and copyrights related to the Russell Indexes. 
Russell® is a trademark of Frank Russell Company. Neither Russell nor its licensors accept any liability for any errors or omissions in the Russell Indexes and/or Russell ratings or underlying data and no party may rely on any Russell Indexes and/or Russell ratings and/or underlying data contained in this communication. No further distribution of Russell Data is permitted without Russell's express written consent. Russell does not promote, sponsor or endorse the content of this communication.

BLOOMBERG® is a trademark and service mark of Bloomberg Finance L.P. and its affiliates (collectively "Bloomberg"). Bloomberg or Bloomberg's licensors own all proprietary rights in the Bloomberg Indices. Bloomberg neither approves or endorses this material, or guarantees the accuracy or completeness of any information herein, or makes any warranty, express or implied, as to the results to be obtained therefrom and, to the maximum extent allowed by law, neither shall have any liability or responsibility for injury or damages arising in connection therewith.

MSCI makes no express or implied warranties or representations and shall have no liability whatsoever with respect to any MSCI data contained herein. The MSCI data may not be further redistributed or used as a basis for other indices or any securities or financial products. This report is not approved, reviewed or produced by MSCI.

Source: FTSE International Limited ("FTSE") © FTSE 2022. "FTSE®" is a trade mark of the London Stock Exchange Group companies and is used by FTSE International Limited under license. All rights in the FTSE indices and/or FTSE ratings vest in FTSE and/or its licensors. Neither FTSE nor its licensors accept any liability for any errors or omissions in the FTSE indices and/or FTSE ratings or underlying data and no party may rely on any FTSE indices, ratings and/or data underlying data contained in this communication. No further distribution of FTSE Data is permitted without FTSE's express written consent. FTSE does not promote, sponsor or endorse the content of this communication.

The views expressed are those of the author(s) and are subject to change at any time. These views are for informational purposes only and should not be relied upon as a recommendation to purchase any security or as a solicitation or investment advice from the Advisor. No forecasts can be guaranteed.

Unless otherwise indicated, logos and product and service names are trademarks of MFS® and its affiliates and may be registered in certain countries. 

50560.20
close video